
One of the current challenges in the pharmaceutical industry is the reliable quantification of Active Pharmaceutical Ingredients (APIs) in a substrate.
Optical spectroscopy is a preferred method in this application due to its simplicity. However, at low API concentrations, the sensitivity of current FTIR-based equipment is not sufficient.
The dual-comb spectrometer IRis-F1 provides a solution, exploiting the high brightness of the laser source for increased signal-to-noise ratio. Thanks to this, it allows to quantify API (such as acetylsalicylic acid) content as lowas0.125% (by mass) within a 15% errormargin.
Mid-IR spectroscopy for API monitoring
Each group of atoms within a molecule vibrates with a characteristic energy. Knowing the energy specific to those vibrations, especially in the “fingerprint” region, allows to identify molecules based on their absorbance spectra.
This makes mid-IR based methods highly specific in the identification of organic molecules and significantly more sensitive than near-IR methods, which provide information on usually much weaker overtone absorptions. However, many other substances are also absorbing in the mid-IR range, which proves challenging for quantifying analytes in matrices of high absorption.
The high power and sensitivity of the IRis-F1 allows to monitor substances in environments with high background absorption (see our application note on optically dense samples) or when long pathlengths through e.g. ATR crystals with many bounces are needed.
The very fast non-invasive measurements with simple workflows available with the IRis-F1 permit continuous monitoring of processes.
Measurements
We chose acetylsalicylic acid (Sigma-Aldrich, ≥ 99.0%) as a model API and lactose (MORGA Milchzucker) as a matrix. Lasers centered at 1760 cm-1 (coverage 1740-1780 cm-1) were chosen to minimize overlaps with lactose peaks and spectral interferences coming from its mutarotation.
A set of mixtures was prepared with varying content of acetylsalicylic acid from 1% down to 0.125% (by mass %), mixed and ground using a mortar.
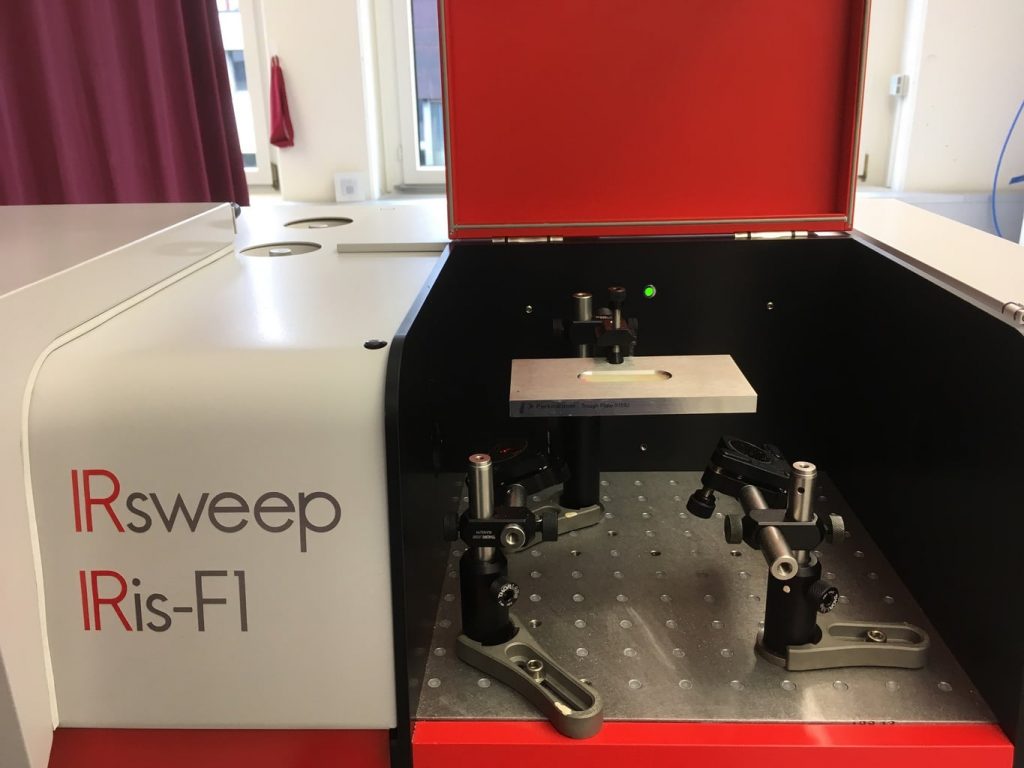
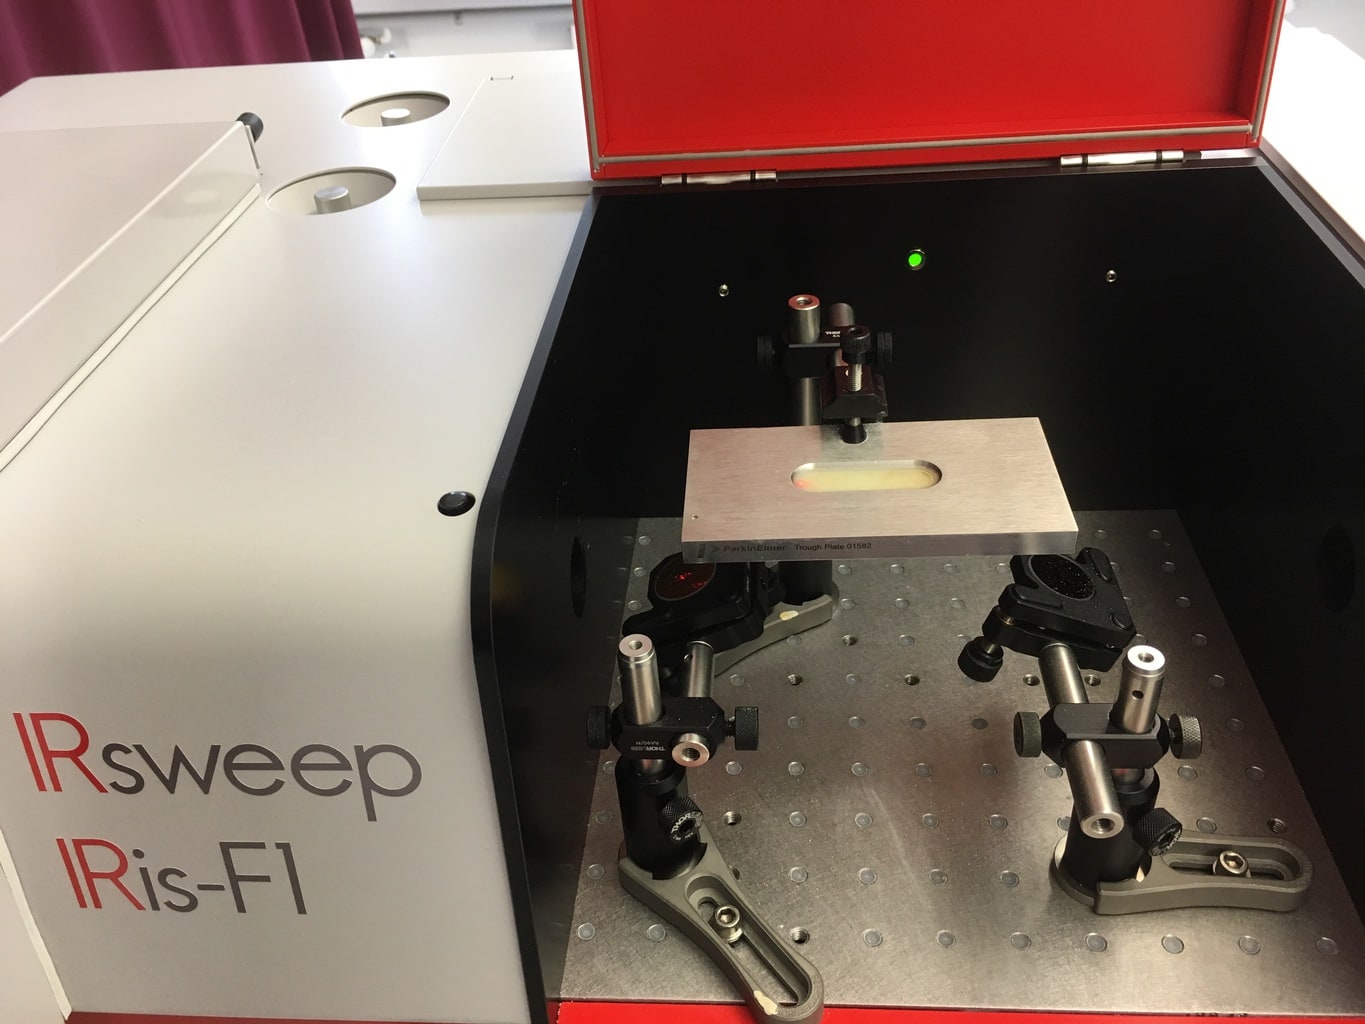
For the validation measurements, the powder was transferred onto an ATR crystal (ZnSe, PerkinElmer, 13 reflections; see the experimental setup in Figure 1) and a contact with the crystal was ensured adding a few drops of isopropanol.
For each sample, data was acquired for <0.5 s, resulting in <2 min total experiment time including applying the mixture to the ATR, creating the slurry and cleaning the ATR crystal after the measurement.
At least 3 repetitions per concentration were performed consisting of removal of the sample from the ATR crystal and replacing it with another from the same batch. It confirmed good mixing and the reproducibility of the results. Spectral signature of acetylsalicylic acid was recognized in each sample from the studied set.
Results
We observed a band at ca. 1750-1760 cm-1. It was assigned to in-plane stretching C=O vibration and confirmed to be present in the reference IR spectrum of acetylsalicylic acid from the NIST database.
In order to eliminate the influence of impurities in the lactose, control measurements with lactose only were performed for the same spectral range and showed no analyte signature, confirming the observed feature to originate in acetylsalicylic acid. Very weak and broad features originating in lactose samples were also observed in the probed region. Their intensity and vibrational energy however did not interfere in this spectral range with the observation of the analyte.
In the case of observation around 1200 cm-1, on the other hand, the peaks of two substances overlap and more involving lactose subtraction must be performed for the quantification of the results.
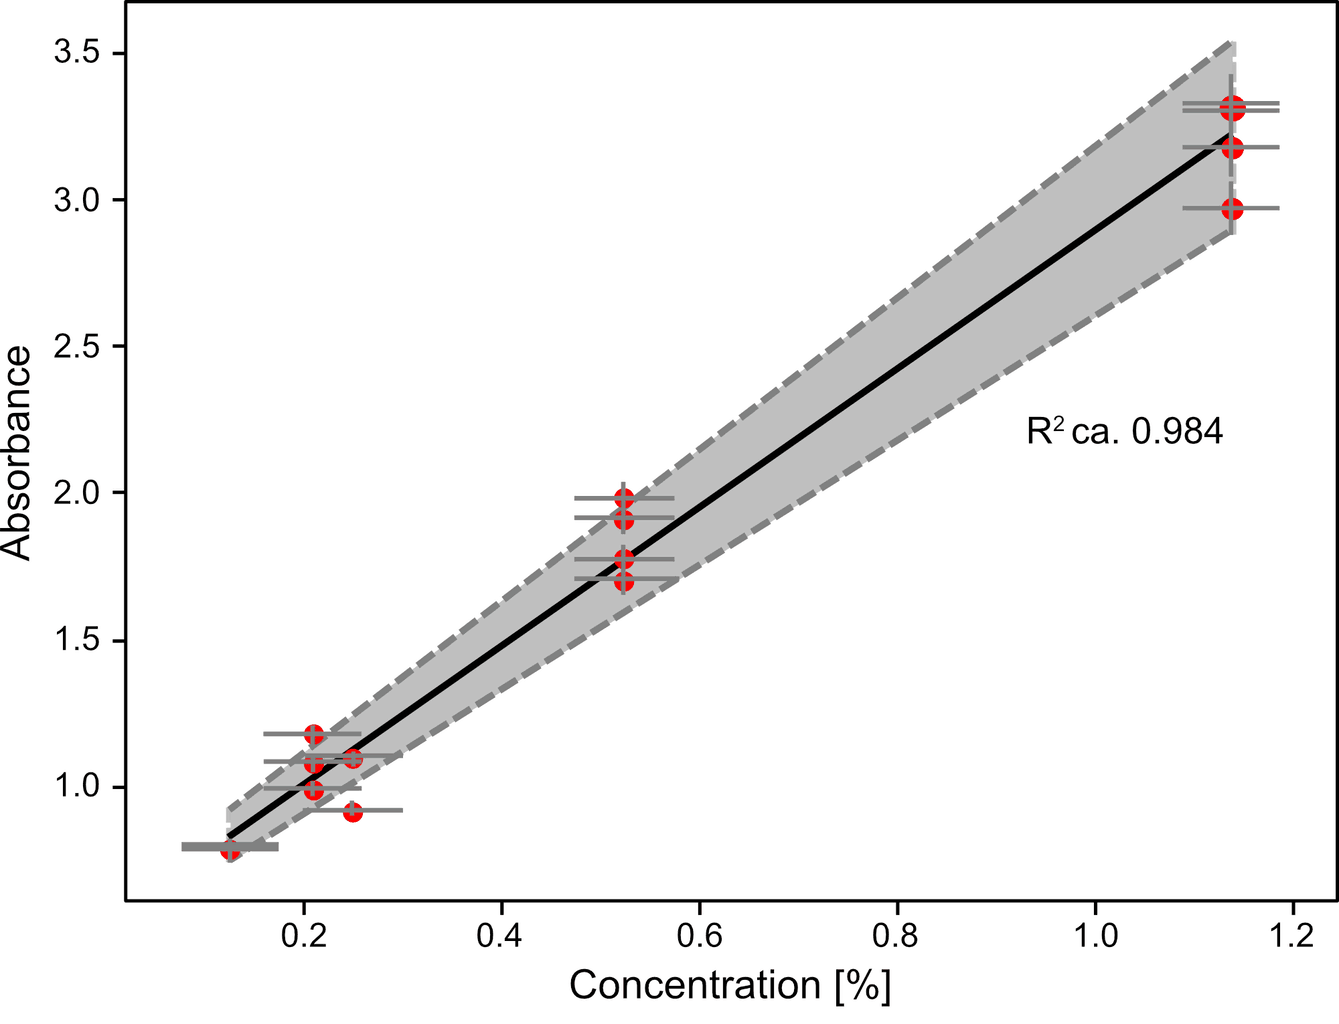
The results (Figure 2) show that acetylsalicylic acid peak was observed with its levels down to 0.125% and that absorbance dependence on the concentration is well linear with R2 = 0.98.
The reproducibility of the absorption measurements (peak area) shown as grey borders is within 10%. The peak area was calculated directly from the plotted data (and further compared to the corresponding concentration values) with no need for any chemometric analyses.
This numerical calculation and slight variations in peak shape were assessed to carry an uncertainty of ca. 3% of the readout value, shown as y error bars in the figure.
Error bars on the x axis were assumed to be constant, and represent a concentration value of 0.05% – a value corresponding to the highest uncertainty among investigated samples originating in the scale readout.
Conclusions
Our results underline the sensitivity advantage of IRis-F1 over other systems, in particular FTIR in such short times.
With the IRis-F1, it is possible to reproducibly measure aspirin content in lactose in doses as low as (0.125±0.006)% per mass. Thanks to the simultaneous monitoring of more than 200 lines, it is possible to monitor several species while still exploiting the high brightness of the laser sources.
With the ease of development of quantitative models for APIs and a simple workflow, the IRis-F1 is an excellent tool offering the possibility of process monitoring.
Related products
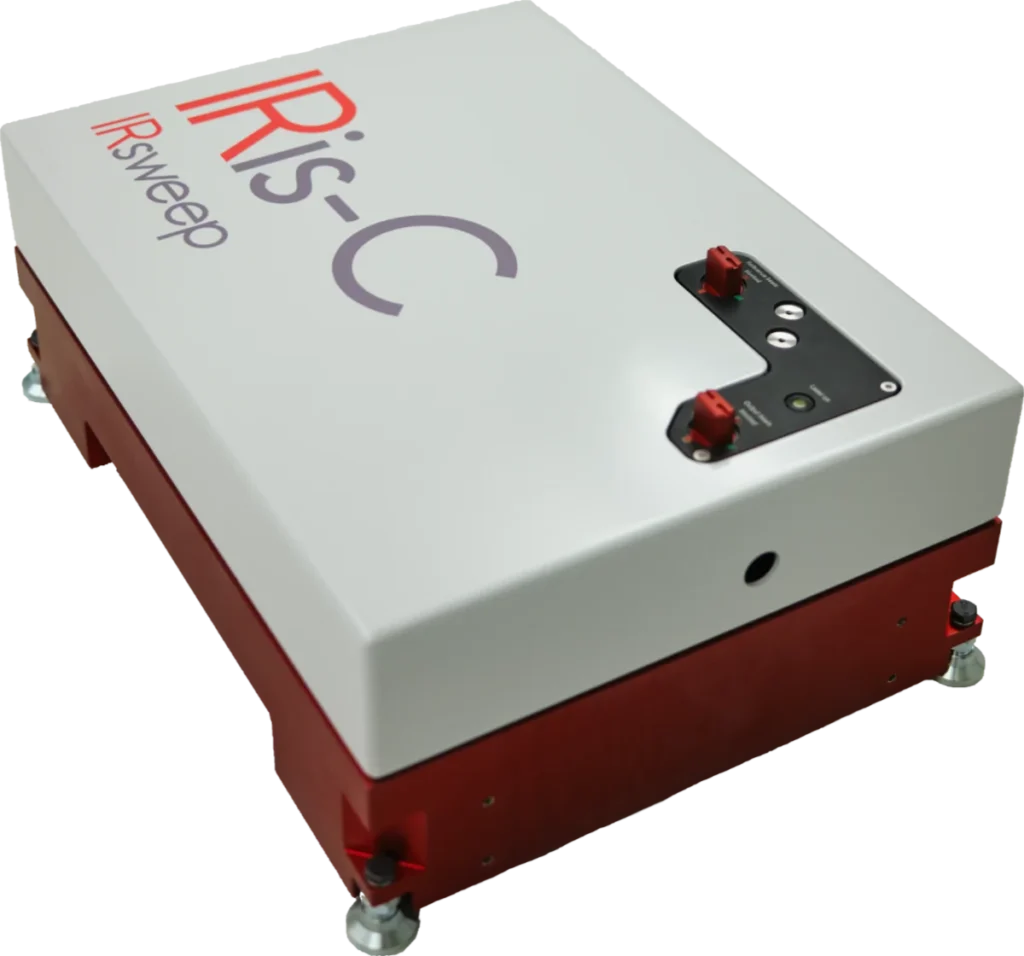
IRis-C
The IRis-C is the next generation instrument in IRsweep’s quantum cascade laser frequency comb spectrometer line. It uses the same dual-comb spectroscopy technology as IRsweep’s IRis-F1, offering microsecond time-resolution, high spectral resolution, and high optical brightness in the mid-infrared. With a substantial reduction in physical dimensions and price, it is easily adaptable to any type of application and fits even tighter budgets.
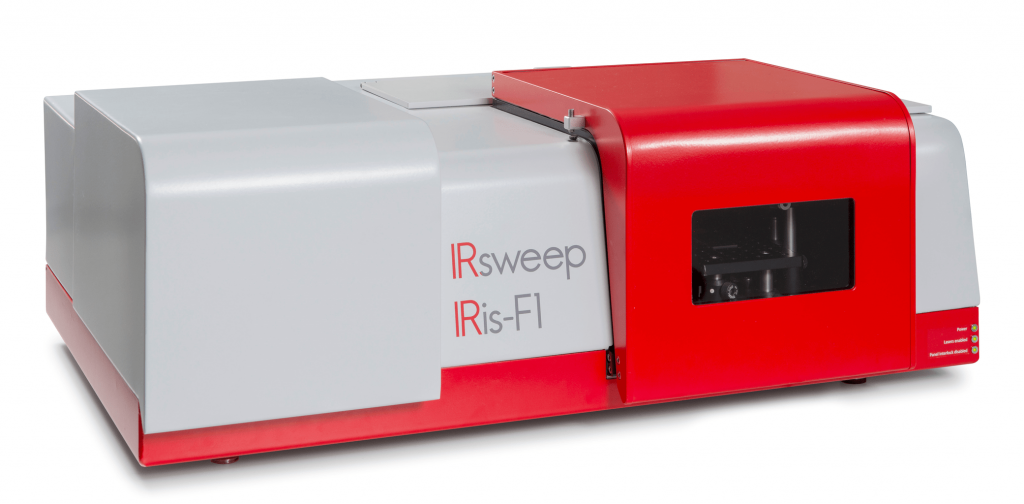
IRis-F1
The IRis-F1 spectrometer offers you an unmatched combination of speed, brightness and multi-color measurements. The quantum cascade laser frequency comb spectrometer is the first turn-key frequency comb spectroscopy system. As opposed to single-frequency operation, which necessitates tuning over your spectral range of interest, you will achieve a broad spectral coverage in a single-shot measurement.
IRis-core
The IRis-core is an ideal basis for the setup of such a system in the mid-IR range: It offers two overlapping free-running QCL-based frequency comb lasers in a single system. The system outputs already co-aligned beams and comes with a set of drive instructions with factory-characterized heterodyning conditions. The system comes complete with drive electronics and a control computer with a graphical user interface.