There are several reasons why users may want to measure infrared spectra of optically dense samplesor onstrongly absorbing backgrounds. For instance, scientifically relevant samples in heterogeneous catalysis or biology often consist of an analyte embedded in a complex matrix. Removing the analyte from this matrix to make it amenable to spectroscopic investigations can alter its behavior. Similarly, in situ process monitoring can be difficult if the materials surrounding the spectroscopically relevant species is strongly absorbing.
Another reason is to increase the sensitivity of a solution-phase measurement by increasing the optical pathlength. For most commonly used spectroscopic solvents, this method is limited by solvent absorption.
This application note explores the use of long-pathlength transmission samples to increase the sensitivity in solution-phase measurements. It is made possible by using the high-intensity laser source of the IRis-F1 spectrometer, which can be used to conduct spectroscopic measurements through backgrounds with optical densities greater than 2.
Experiment

Experiments were carried out on the IRis-F1 dual-comb mid-infrared spectrometer. An important difference of the IRis-F1 compared to traditional mid-infrared spectrometers is the use of a pair of frequency comb lasers as a light source. It allows much higher light intensities to be achieved, and therefore more optically dense samples to be probed when compared to traditional global sources.
Measurements were conducted in transmission mode with an optical pathlength of 100 µm, an acquisition time of 2 minutes and a spectral resolution of 4 cm-1.
The analyte acetylsalicylic acid (aspirin) has a band centered at 1202 cm-1 and was measured in water at a range of concentrations, starting from a saturated solution (3 mg/ml).
The laser power was adjusted to achieve the maximum possible throughput with the background sample in place. The upper limit for the pathlength was determined to be approximately 100 µm of water at 1180 – 1240 cm-1; above this, the laser power is insufficient to penetrate the solvent background.
Results and discussion
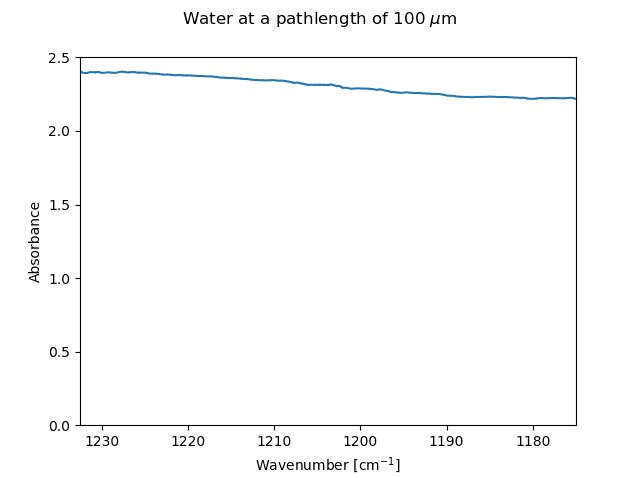 The spectrum of water measured at a pathlength of 100 um
In the probe region of 1180 – 1240 cm-1 the solvent used (water) shows a broadly absorbing background with an optical density of ca. 2 at this path length. The figure above shows the spectrum of the solvent measured on an air background.
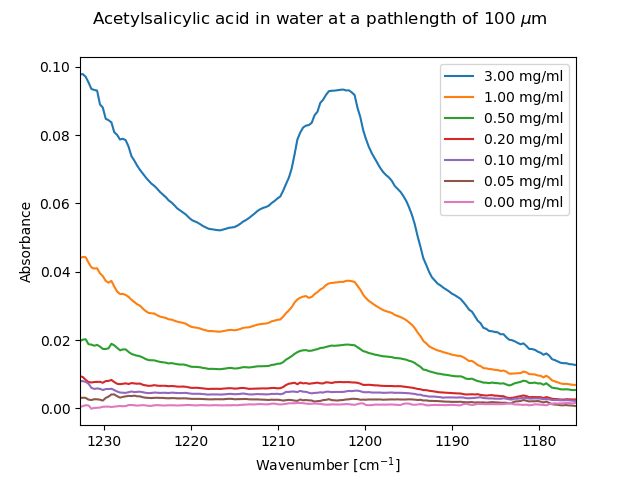 Acetylcalacylic acid in water measured against a water background at several concentration.
The spectrum above shows the measured acetylcalacylic acid at a number of concentrations when the solvent signal is used as a background.
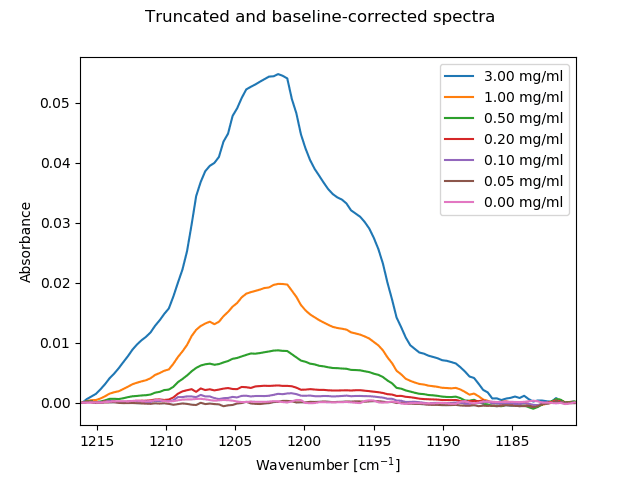 The isolated and baseline-corrected analyte peak
The analyte peak can clearly be seen to concentrations as low as 0.10 mg/ml, even on top of a very large background absorption. Baseline correction improves the result since the large ratio of solvent background to signal intensity can lead to somewhat larger baseline offsets than would be observed with a more transparent sample medium.
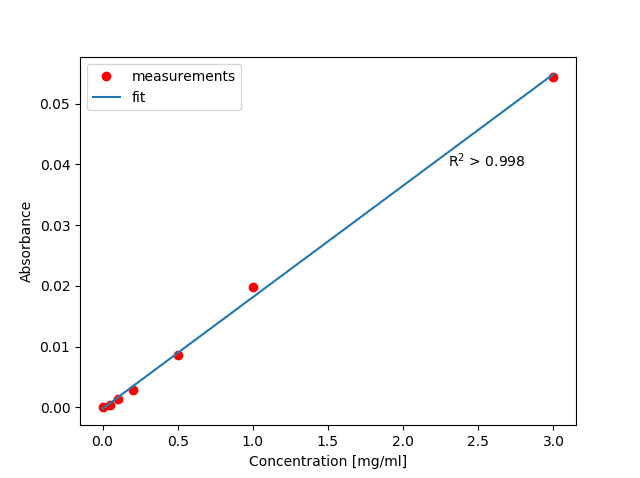 The resulting regression analysis at 1202 cm-1
By using a linear baseline correction, the band can be isolated, and a regression analysis shows a good fit to very low concentrations of analytes.
Conclusion
It is shown that using long path lengths for the measurement of dilute samples can boost sensitivity with respect to traditional techniques. This is a unique possibility afforded by using a laser source. This advantage is also applicable to heterogeneous catalysis, proteins in aqueous solutions and other complex samples.
Additional content
Related products
IRis-C
The IRis-C is the next generation instrument in IRsweep’s quantum cascade laser frequency comb spectrometer line. It uses the same dual-comb spectroscopy technology as IRsweep’s IRis-F1, offering microsecond time-resolution, high spectral resolution, and high optical brightness in the mid-infrared. With a substantial reduction in physical dimensions and price, it is easily adaptable to any type of application and fits even tighter budgets.
IRis-F1
The IRis-F1 spectrometer offers you an unmatched combination of speed, brightness and multi-color measurements. The quantum cascade laser frequency comb spectrometer is the first turn-key frequency comb spectroscopy system. As opposed to single-frequency operation, which necessitates tuning over your spectral range of interest, you will achieve a broad spectral coverage in a single-shot measurement.
IRis-core
The IRis-core is an ideal basis for the setup of such a system in the mid-IR range: It offers two overlapping free-running QCL-based frequency comb lasers in a single system. The system outputs already co-aligned beams and comes with a set of drive instructions with factory-characterized heterodyning conditions. The system comes complete with drive electronics and a control computer with a graphical user interface.