Fast spectroscopic monitoring is a proven tool in R&D and production environments, where it is used to gain insight into chemical reactions. This application note showcases how the IRis-F1 dual-comb spectrometer (DCS) can be used to monitor curing reactions, where it can provide invaluable insight on the performance of coatings and adhesives.
Infrared spectroscopy is in many ways an ideal measurement technique for this application as it is capable of performing non-invasive in-situ measurements that provide direct information about the structure and bonding of the sample. However, many high-performance adhesives possess fast curing rates and the speed of off-the-shelf spectroscopic techniques is the limiting factor in their analysis.
The IRis-F1 is based on quantum cascade laser (QCL) frequency comb technology, which allows for measurements onmicrosecond to minute timescales to be carried out.

By loading the video, you agree to YouTube’s privacy policy.
Learn more
Experiment
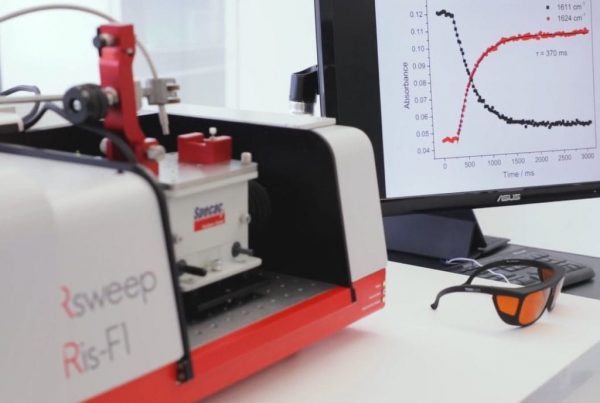
The experimental setup is shown above. Measurements were conducted with a single-reflection diamond Golden Gate ATR accessory (Specac). The sample is a UV-activated adhesive, which was kindly provided by DELO Industrial Adhesives (Germany). When uncured it has an infrared band at 1613 cm-1 and a new band at 1638 cm-1 after curing. For each measurement a background file was initially acquired after cleaning the ATR crystal, followed by a rapid series of measurements spanning before, during, and after curing.
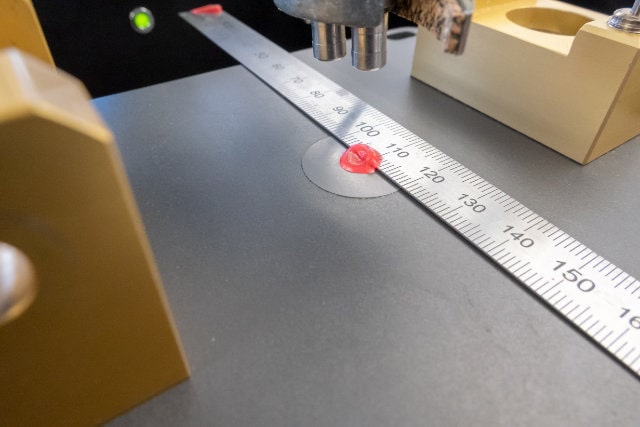
The QCL used operates at 1585–1645 cm-1. The spectrometer was set to a resolution of 4 cm-1 and the acquisition time was 1 ms, with a repetition rate of 40 Hz. At these settings, continuous acquisitions can be acquired for ca. 30 seconds before the buffer fills and repetition rate is reduced to the order of 1 Hz. Curing was triggered using a mercury lamp (LC8, Hamamatsu), via an optical fiber (see Figure above). After starting the measurement, the lamp is turned on to initiate the curing reaction and the resulting spectra are recorded as a time-series.
Results and discussion
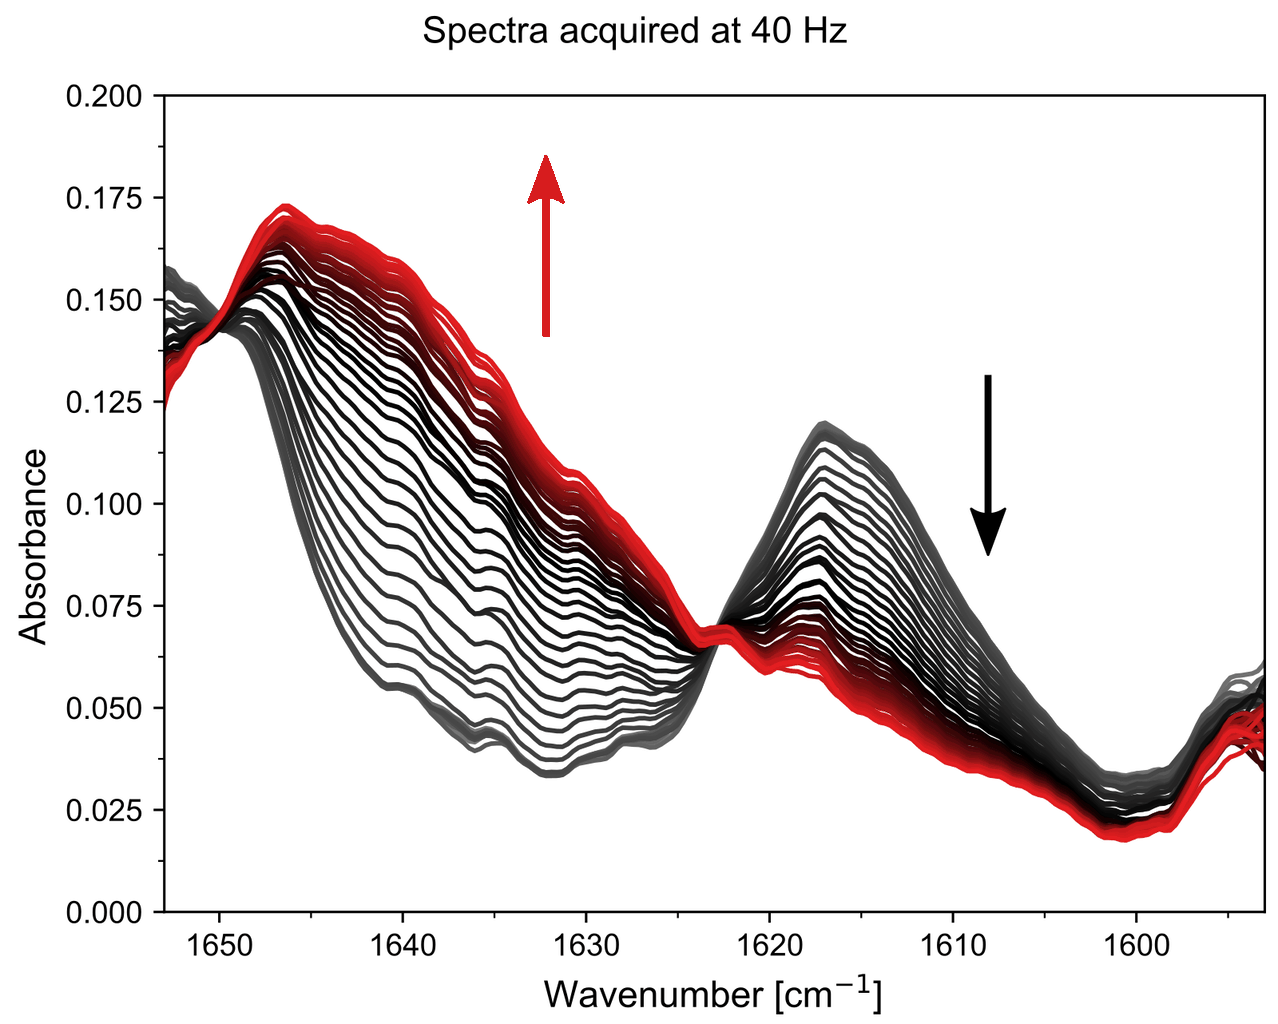
The figure shows the spectra acquired in time-increments of 25 ms. A good signal to noise ratio is obtained even at short integration times. It is clear that the band at ca. 1610 cm-1 decays rapidly, while a new band grows at ca. 1640 cm-1.
The raw spectra exhibit fringing, which is expected when using a laser-based instrument with an ATR prism. They are caused by a change in the refractive index of the sample (i.e. glue vs air) changing the penetration depth of the ATR accessory. Thanks to the well-defined periodicity of the fringes, they could be removed with a simple Fourier transform (FT) filter.
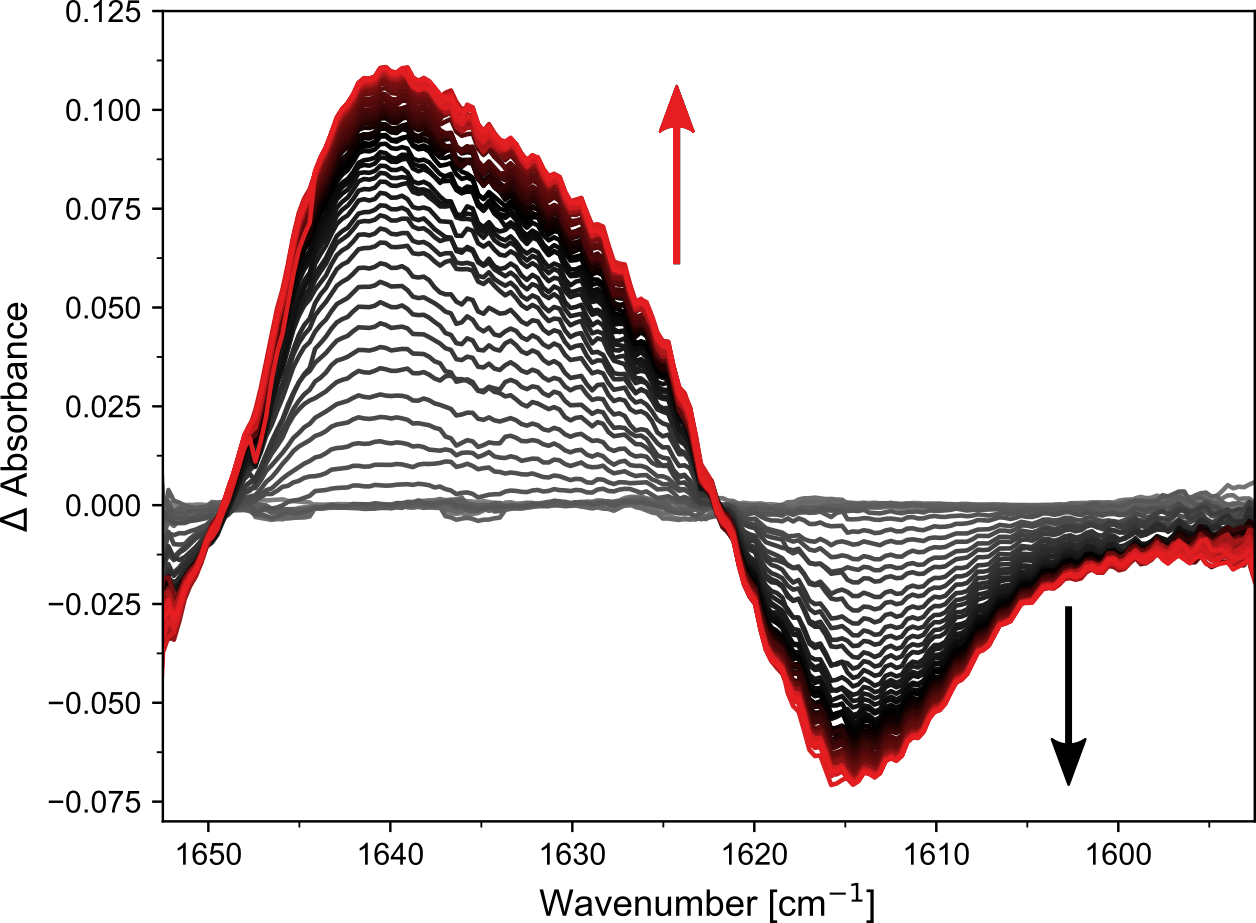
Difference spectra can be generated by subtracting a spectrum of the uncured glue (defined as a negative-time spectrum) from each of the subsequent positive-time spectra. The figure below (left) shows the resulting difference spectra, which highlight the changes produced by the curing reaction in 25 ms increments. Negative bands show that a feature has disappeared, while positive bands show that a new feature has grown in. Here it is evident that not one, but two new bands grow in, at ca. 1638 and 1624 cm-1. It should be noted that no FT filtering was applied to these spectra.
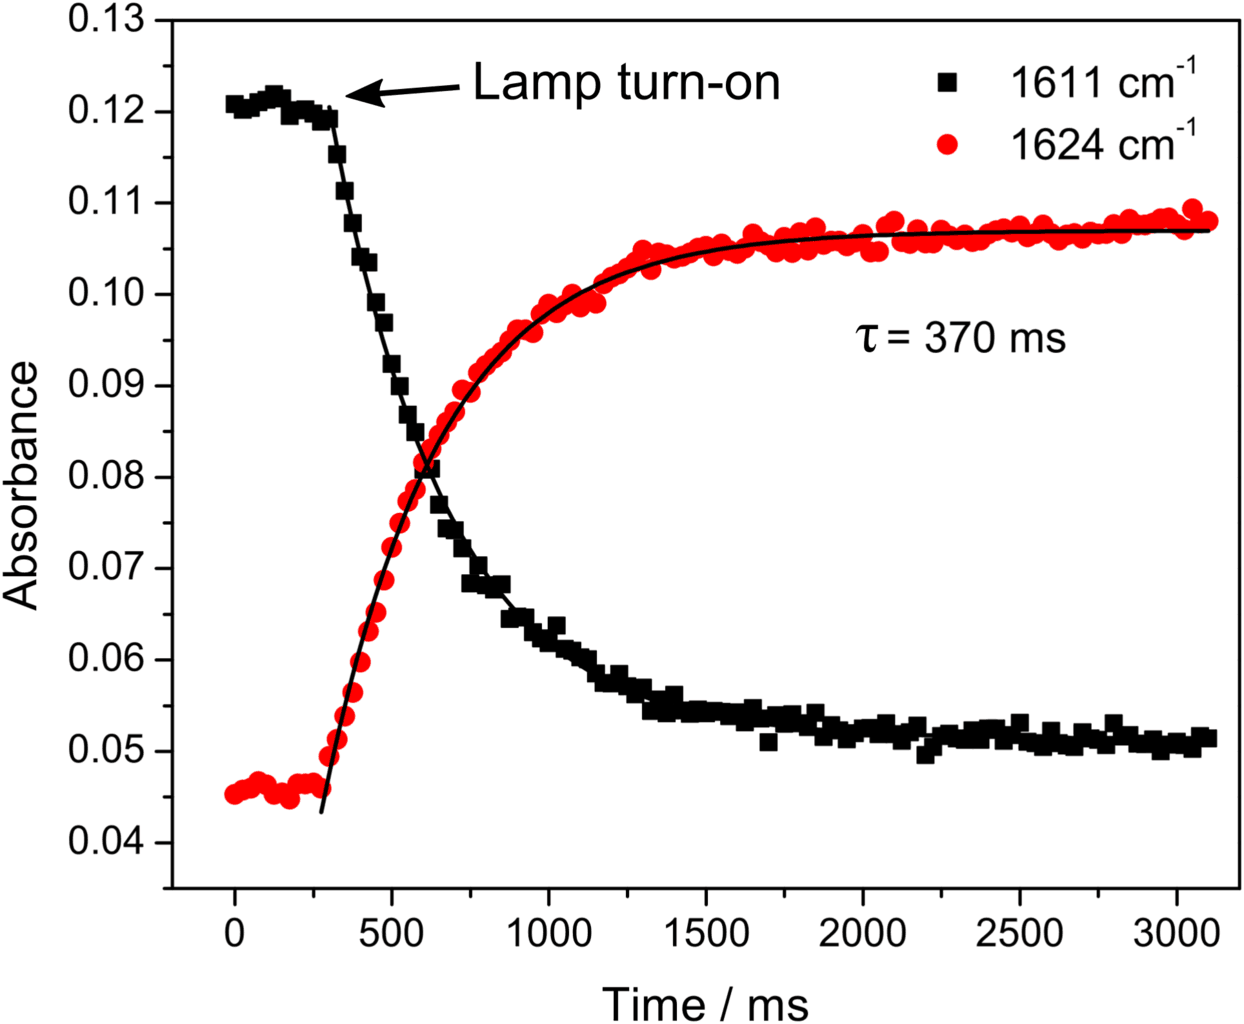
The kinetic traces at two points in the spectra clearly show the time-point where the lamp was turned on. By fitting the growth and decay of these points, the kinetic properties of the curing process can be determined. In this case, a life-time (τ) of 370 ms was found. The exact nature of the reaction is probably dependent on the sample thickness and irradiation power, which are parameters that were not fully controlled for these measurements.
Conclusion
Rapid measurements with high signal to noise ratios were performed on a sample of glue during curing, giving insight on processes that happen on a millisecond timescale. This bridges the previously demonstrated capabilities of the IRis-F1 to measure on the microsecond timescale, with the second to minute timescale. It enables processes over many orders of magnitude in time to be studied.
Faster measurementsare possible from the point of view of the spectrometer, however, the present setup appears to be limited by the lamp turn-on time and brightness. A different curing source (e.g. a laser) should allow microsecond timescales to be reached.
Additional content
Related products
IRis-C
The IRis-C is the next generation instrument in IRsweep’s quantum cascade laser frequency comb spectrometer line. It uses the same dual-comb spectroscopy technology as IRsweep’s IRis-F1, offering microsecond time-resolution, high spectral resolution, and high optical brightness in the mid-infrared. With a substantial reduction in physical dimensions and price, it is easily adaptable to any type of application and fits even tighter budgets.
IRis-F1
The IRis-F1 spectrometer offers you an unmatched combination of speed, brightness and multi-color measurements. The quantum cascade laser frequency comb spectrometer is the first turn-key frequency comb spectroscopy system. As opposed to single-frequency operation, which necessitates tuning over your spectral range of interest, you will achieve a broad spectral coverage in a single-shot measurement.
IRis-core
The IRis-core is an ideal basis for the setup of such a system in the mid-IR range: It offers two overlapping free-running QCL-based frequency comb lasers in a single system. The system outputs already co-aligned beams and comes with a set of drive instructions with factory-characterized heterodyning conditions. The system comes complete with drive electronics and a control computer with a graphical user interface.